BLH Experimental Demonstration Research Design
Winter 2018-19 Demonstration Project: Broccoli
Objective
Determine differences between growth and condition of broccoli using Aquatonix treated water vs non-treated water
Summary of Results
Running the Welch t test, a p-value of 0.08772 was calculated which fails to reject the hypothesis and means there is NO statistically significant difference between the two groups. This means neither the BLH or Control broccoli weigh more or less, they are statistically identical.
A basic regression model of the broccoli weights was then calculated as a function of treatment/control water. It was found that the Aquatonix water had a negative effect on weights (about -63 g if BLH water) but wasn’t significant at the 95% level.
Project
Use of 6 raised beds randomly assigned demonstrate use of Aquatonix to students and growers. Broccoli will be grown with no differences in cultural or production practices between treatment and control beds except for the source of water.
BLH Agrees to:
- Provide Aqutonix to the participant free of charge;
- Coordinate delivery of Aqutonix to the participant's designated location;
- Provide a product installation and maintenance manual;
- Provide a $xxxx stipend for a student to oversee the Project including data collection, irrigation system, documentation of growth and harvest, and care of the plants;
- Provide $xxxx for costs associated of piping, tubing, control valves, and gauges required for irrigation system to use the Aqutonix machine;
- Be responsible for the costs of testing water and soil for baseline data; and the costs of testing tissues and fruit during the test plan.
Coalinga College Agree to:
- Use Aqutonix treated water on treatment beds and nontreated water on control beds from the beginning of planting to harvest.
- Maintain cultural and production practices on all treated and control beds
- Provide measurement and images of product growth, yield, and quality throughout the
growing season. This includes but is not limited to:
- Weight of crops that had to be discarded due to pests and diseases
- Individual crop weight and size of control and treated crops (please include image of five pieces of the fruit or vegetable on a scale)
- Sugar content of control and treated crops
Data Gathering Phase:
Dr. Ellsworth determined that the broccoli were ready to be harvested on Wednesday the 23rd. Before harvest, we had rain events and had to keep the broccoli covered in plastic to prevent rainwater from getting into all of the planter boxes and diluting the impact of Aquatonix treatments. Because some leaves were damaged by the plastic covering, in order to be consistent in the measurements, all leaves were removed from all the broccoli so we had the same comparability in each box and each plant.
After we removed the leaves, we cut each broccoli free at the ground level and weighed each stalk/crown. We did each block individually and made sure to double check and ensure that the broccolis we weighed remained in that order. You will see this in the attachment “ BLH Broccoli Weights” where we numbered each broccoli in each box consistently and removed and weighed in the same manner. We also decided to cut the broccoli and reweight them at what they would be at market, as we thought this may provide some consistency as some broccoli plants stood tall while others were fairly short. We cut each stalk of the broccoli to 4” (inches) below the crown. You will see the difference on the second page of the attached PDF. We made sure that order remained consistent and we followed the same methodology each broccoli and each box we sampled.
Descriptive Stats:
After receiving all of the weights I manually entered each into an excel sheet so I could pull them into the statistical software I use for analysis (R software). As someone with an econometric background, I rely heavily on descriptive statistics to give me insight into my data. We will now look at some descriptive stats for the broccoli by water types (before and after cutting):
Before Cutting:
| BLH Weights (grams) | |||
| Min | Median | Mean | Max |
| 180.7 | 411.2 | 446.7 | 1046.2 |
| Control Weights (grams) | |||
| Min | Median | Mean | Max |
| 209.6 | 517 | 510 | 870.9 |
After Cutting:
|
BLH Weights (grams) 4" Stalk |
|||
| Min | Median | Mean | Max |
| 109 | 274.9 | 302.3 | 782 |
|
Control Weights (grams) 4" Stalk |
|||
| Min | Median | Mean | Max |
| 122.4 | 361.3 | 346.4 | 635.7 |
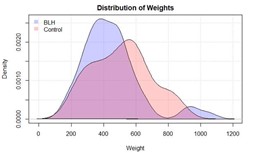
As you can see from the above tables, the BLH broccoli had the lowest weight broccoli and the highest weight broccoli. The control water broccoli had a higher weight on average. I think it is helpful to see this in a graphic so below I will plot the density histogram of both groups (BLH weights vs Control weights – before cutting values as the distribution remains the same)

As you can see, the BLH broccoli had a mean value of about 450g while the controls had about 510g. In a statistical sense, when we hypothesize that two groups will be different (here we expected BLH weights to be higher) we want to see little to no overlap in the distributions. That is, we expect to see little to no purple on the histogram if the two groups are going to be statistically different. This then presents that our hypothesis may be incorrect before we apply the statistical testing.
Statistical Testing:
As mentioned above, when we test a treatment versus a control we expect the two groups to not overlap. Graphics, however, are not the official way we test to see if two groups are different. To do this, we can utilize the Welch two Sample t-test to test whether or not two groups are statistically different from each other. The test itself is looking to see whether the true difference in the means is equal to zero, written in the old statistical notation
H0 (Null hypothesis) = True difference in means equals zero
HA (Alternative Hypothesis) = True difference in means is not equal to zero
If we reject the hypothesis, then we are staying a difference is present. However, if we fail to reject the null hypothesis that means there is no difference in the means between the groups.
We will make the decision on rejecting/failing to reject based on the p-value from the Welch test. If the p-value is above the significance level (here we assume a 95% significance level, as that is common practice. Without lecturing completely on statistics, we want to compare the p-value to our set alpha level which is assumed to be 0.05 for a 95% significance. If p-value is less than 0.05 we will reject the null (difference present) or if it is greater than 0.05 we will fail to reject (no difference present)).
Results:
Running the Welch t test, I find a p-value of 0.08772. This means I fail to reject the hypothesis and there is no statistically significant difference between the two groups. This means neither the BLH or Control broccoli weigh more or less, they are statistically identical. It doesn’t matter how we look at the data either (considered before and after cutting) we still find no statistically significantly difference in the two groups.
We also tested whether the location of the broccoli (North compared to South) had any effect on the broccoli, and found no statistically significant difference there either. In fact, no matter what we hypothesized (different blocks receive different amounts of light? Different spatial effects? ) we found no statistical difference in the two groups.
We then tested a basic regression model of the broccoli weights as a function of treatment/control water. There we found that the BLH machine had a negative effect on weights (about -63 g if BLH water) but it wasn’t significant at the 95% level.
