

Coalinga College has determined the following standards by which to assess the institution. Institution set standards are levels identified by Coalinga College to be acceptable. Institution-Set Standards are reviewed and assessed on a three-year cycle.
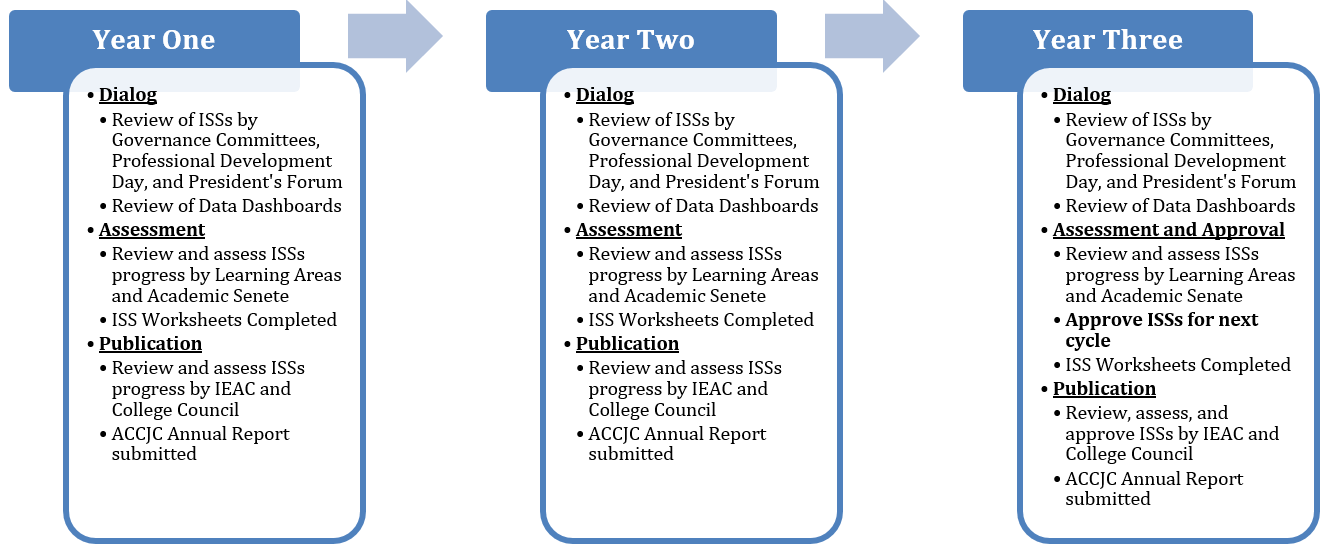
ISS Cycle Timeline
| 2017-18 | Initial Year of Cycle - Standards Set |
|---|---|
| 2018-19 | Assessment Year |
| 2019-20 | Revision/Approval Year |
| 2020-21 | Assessment Year |
| 2021-22 | Assessment Year |
| 2022-23 | Revision/Approval Year |
| 2023-24 | Assessment Year |
| 2024-25 | Assessment Year |
| 2025-26 | Revision/Approval Year |
| 2026-27 | Assessment Year |
| Institution-Set Standard (Minimum Acceptable Performance) | Stretch Goal | Actual Rate 2019-20 | Actual Rate 2020-21 | Actual Rate 2021-22 | Actual Rate 2022-23 | Actual Rate 2023-24 | Actual Rate 2024-25 | |
|---|---|---|---|---|---|---|---|---|
| Course Success Rate | 70% | 75% | 76% | 76% | 76% | 76% | 78% | 82% |
| Degrees Awarded | 325 students per year | 400 students per year | 323 students | 349 students | 347 students | 339 students | 318 students | 342 students |
| Certificates Awarded | 300 students per year | 360 students per year | 140 students | 310 students | 325 students | 293 students | 339 students | 370 students |
| Completion of Degree, Certificate of Achievement or Transfer within Three Years | 25% | 35% | Fall 2019 Cohort 26.3% (n-size 566) |
Fall 2020 Cohort 32.4% (n-size 373) |
Fall 2021 Cohort 30.3% (n-size 432) | Fall 2022 Cohort 32.0% (n-size 482) | Fall 2023 Cohort 24.6%** (n-size 443) | |
| Transfers to Four-Year Institutions | 350 transfers per year | 450 transfers per year | 378 transfers | 392 transfers | 401 transfers | 317 transfers | 345 transfer | 342 transfers |
**Cohort has not had a full three years to complete the metric.
|
Licensure Pass Rates |
Institution-Set Standard (Minimum Acceptable Performance) | Stretch Goal | Actual Rate (2017) | Actual Rate (2018) | Actual Rate (2019) | Actual Rate (2020) | Actual Rate (2021) | Actual Rate (2022) | Actual Rate (2023) |
|---|---|---|---|---|---|---|---|---|---|
|
Psychiatric Technician |
80% |
90% |
53% |
78% |
83% |
60% |
58% |
59% |
69% |
|
Job Placement Rates: |
Institution-Set Standard |
2020-21 |
2021-22 |
2022-23 |
|---|---|---|---|---|
|
Administration of Justice (2105) |
60% |
58% |
63% |
53% |
|
Business Administration (0505) |
60% |
- |
- |
- |
|
Business Management (0506) |
|
26% |
16% |
18% |
|
Child Development (1305) |
60% |
51% |
41% |
43% |
|
Diesel Technology (0947) |
|
52% |
57% |
50% |
|
Psychiatric Technician (1239) |
83% |
70% |
72% |
- |
|
Welding (0956) |
60% |
- |
- |
- |
This metric is currently based on the California Community Colleges Chancellor’s Office Data Vista metric 700SW Unemployed Students Who Became Employed, and reflect employment at the second fiscal quarter after exiting college.
Archived Documents